Nuclear chart player
Nuclear Chart Player#
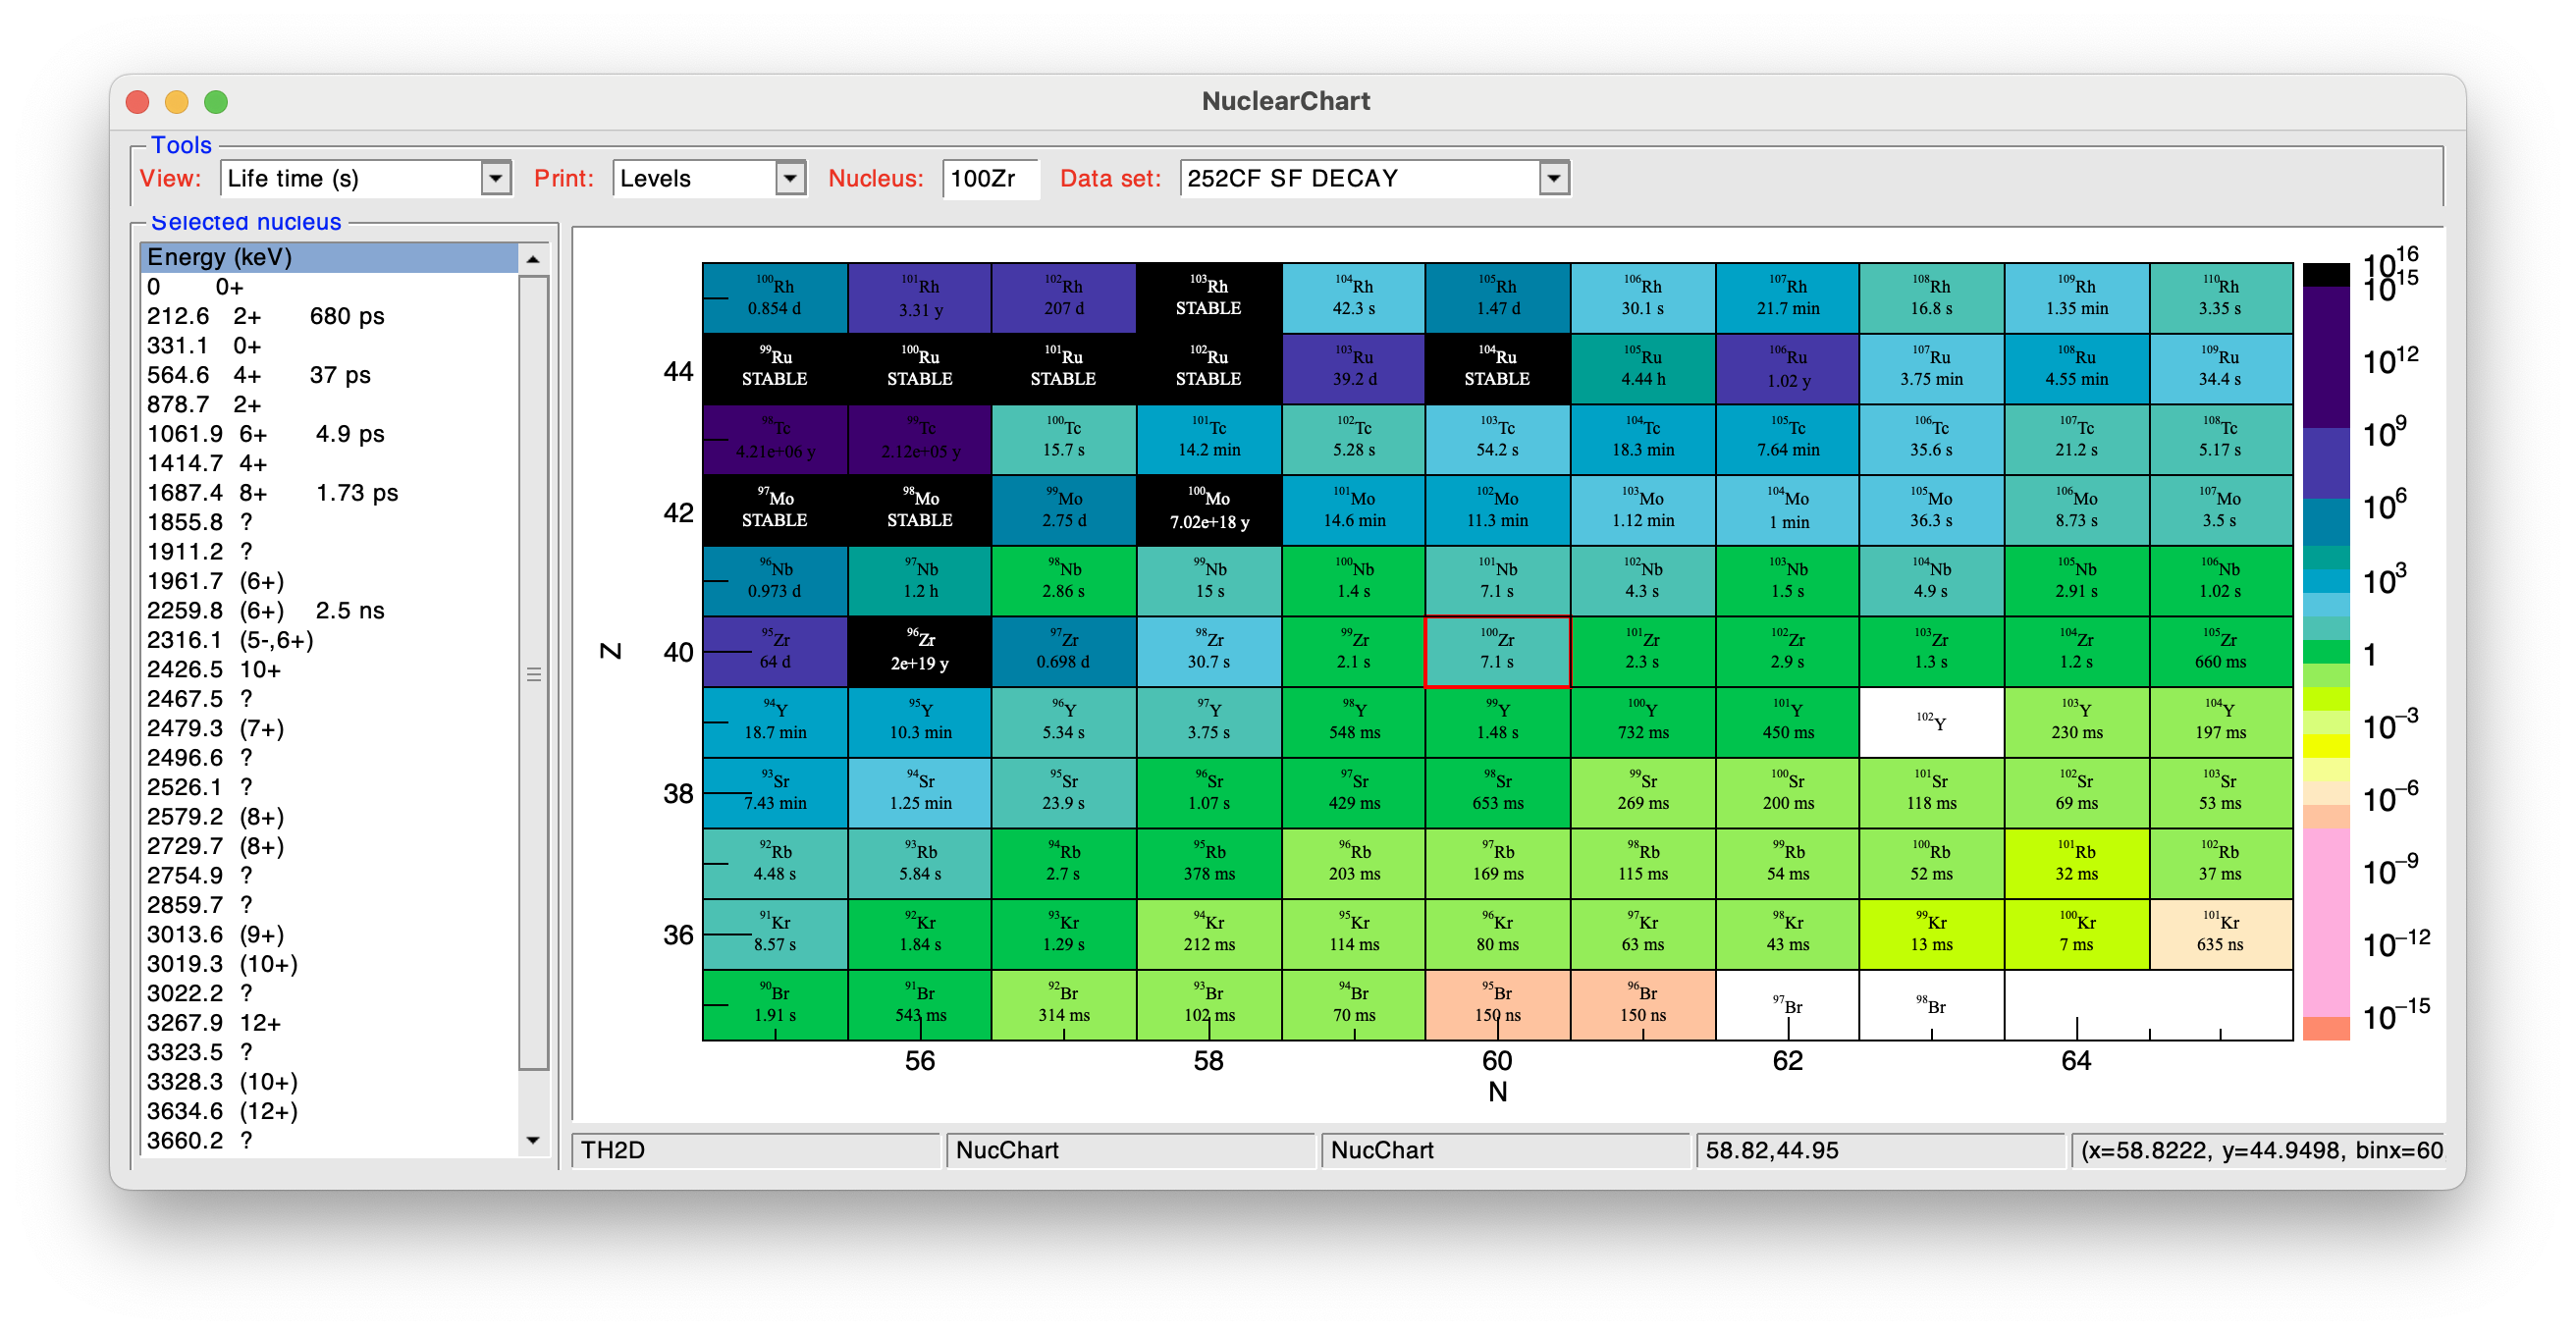
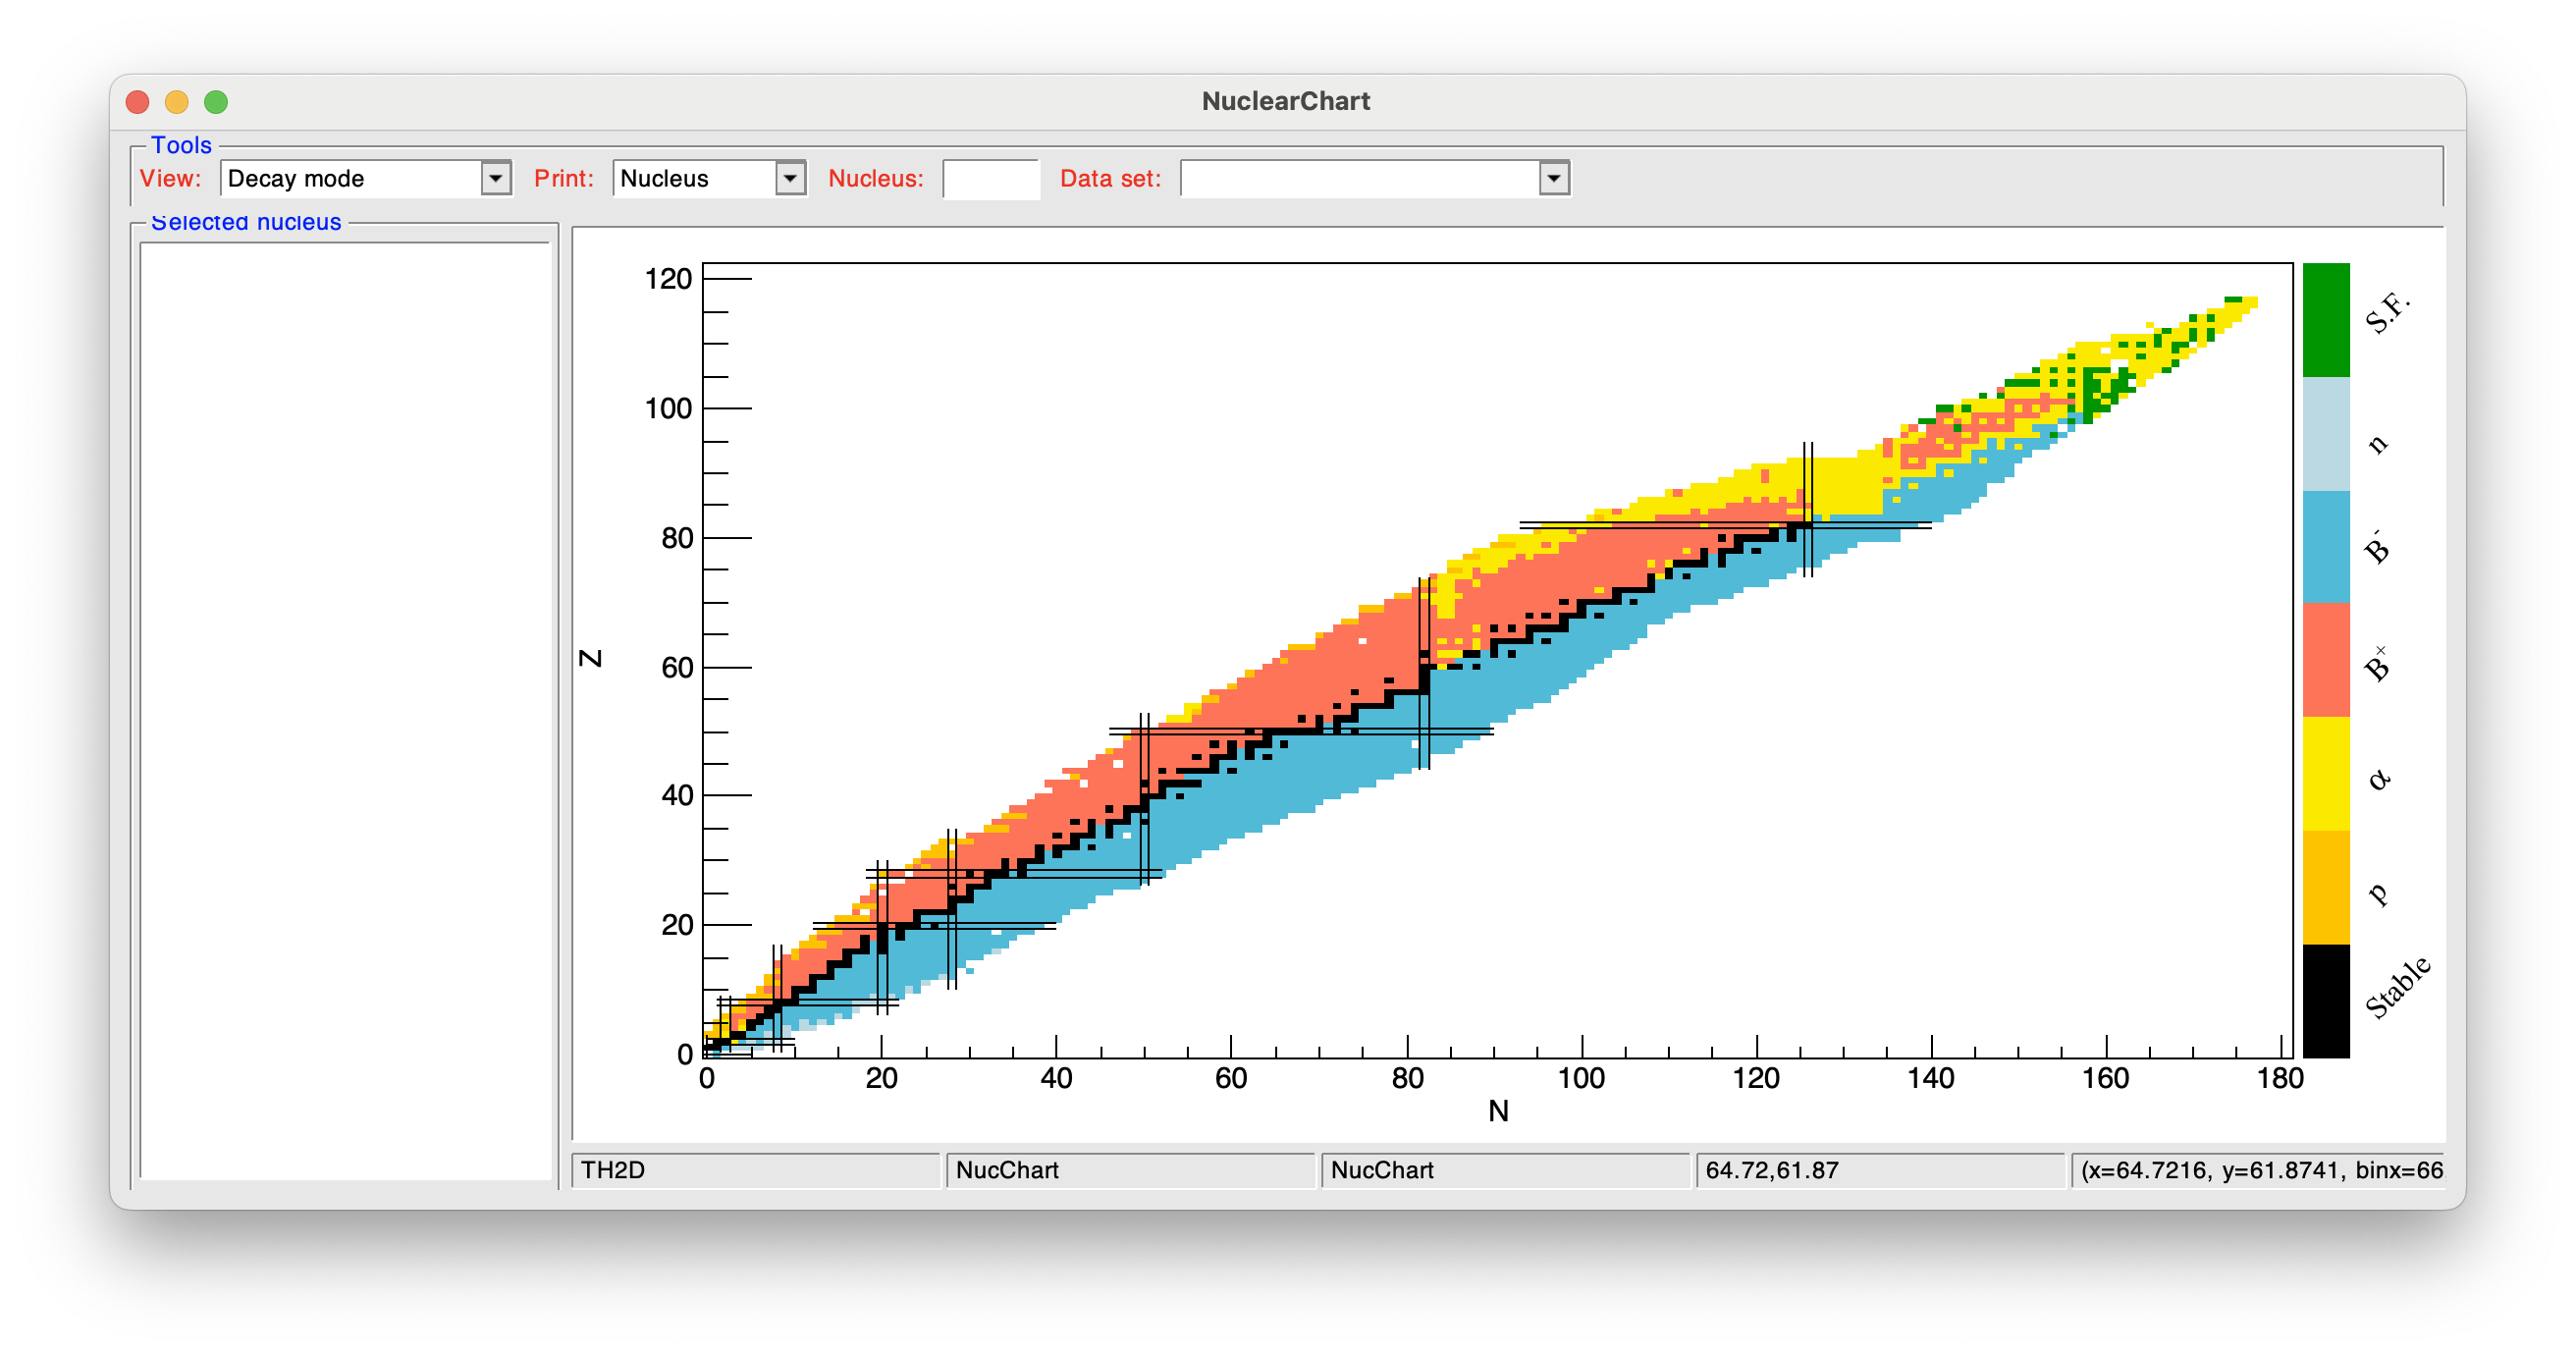
The nuclear chart player allows to plot some nuclear properties over the nuclear chart like:
- Ground state life time
- 1st and 2nd isomer life time
- 1st excited state energy
- Decay mode
- B(E2: \(2^{+}_{1} \rightarrow 0^{+}_{1}\)) in \(e^{2}b^{2}\) and Weisskopf unit
When selecting a nucleus (clicking on it, or writing its name in the Nucleus field will plot in the left pannel and in the terminal the selected information in:
- Nucleus ground state properties
- Nuclear level properties
- Nuclear \(\gamma\)-ray properties
The two last properties will be printed for the selected data-set: