2D spectra utilities
2D spectra utilities#
ɣ-ɣ player#
The \(\gamma-\gamma\) player is used from a 2D histogram (\(\gamma-\gamma\) matrix) to perform coincidence analysis. To start the player, either right click on a 2D histogram from the file browser and select "Init GxG", or right click on a matrix already displayed in a canvas and select "Init GxG". This will display the following view:
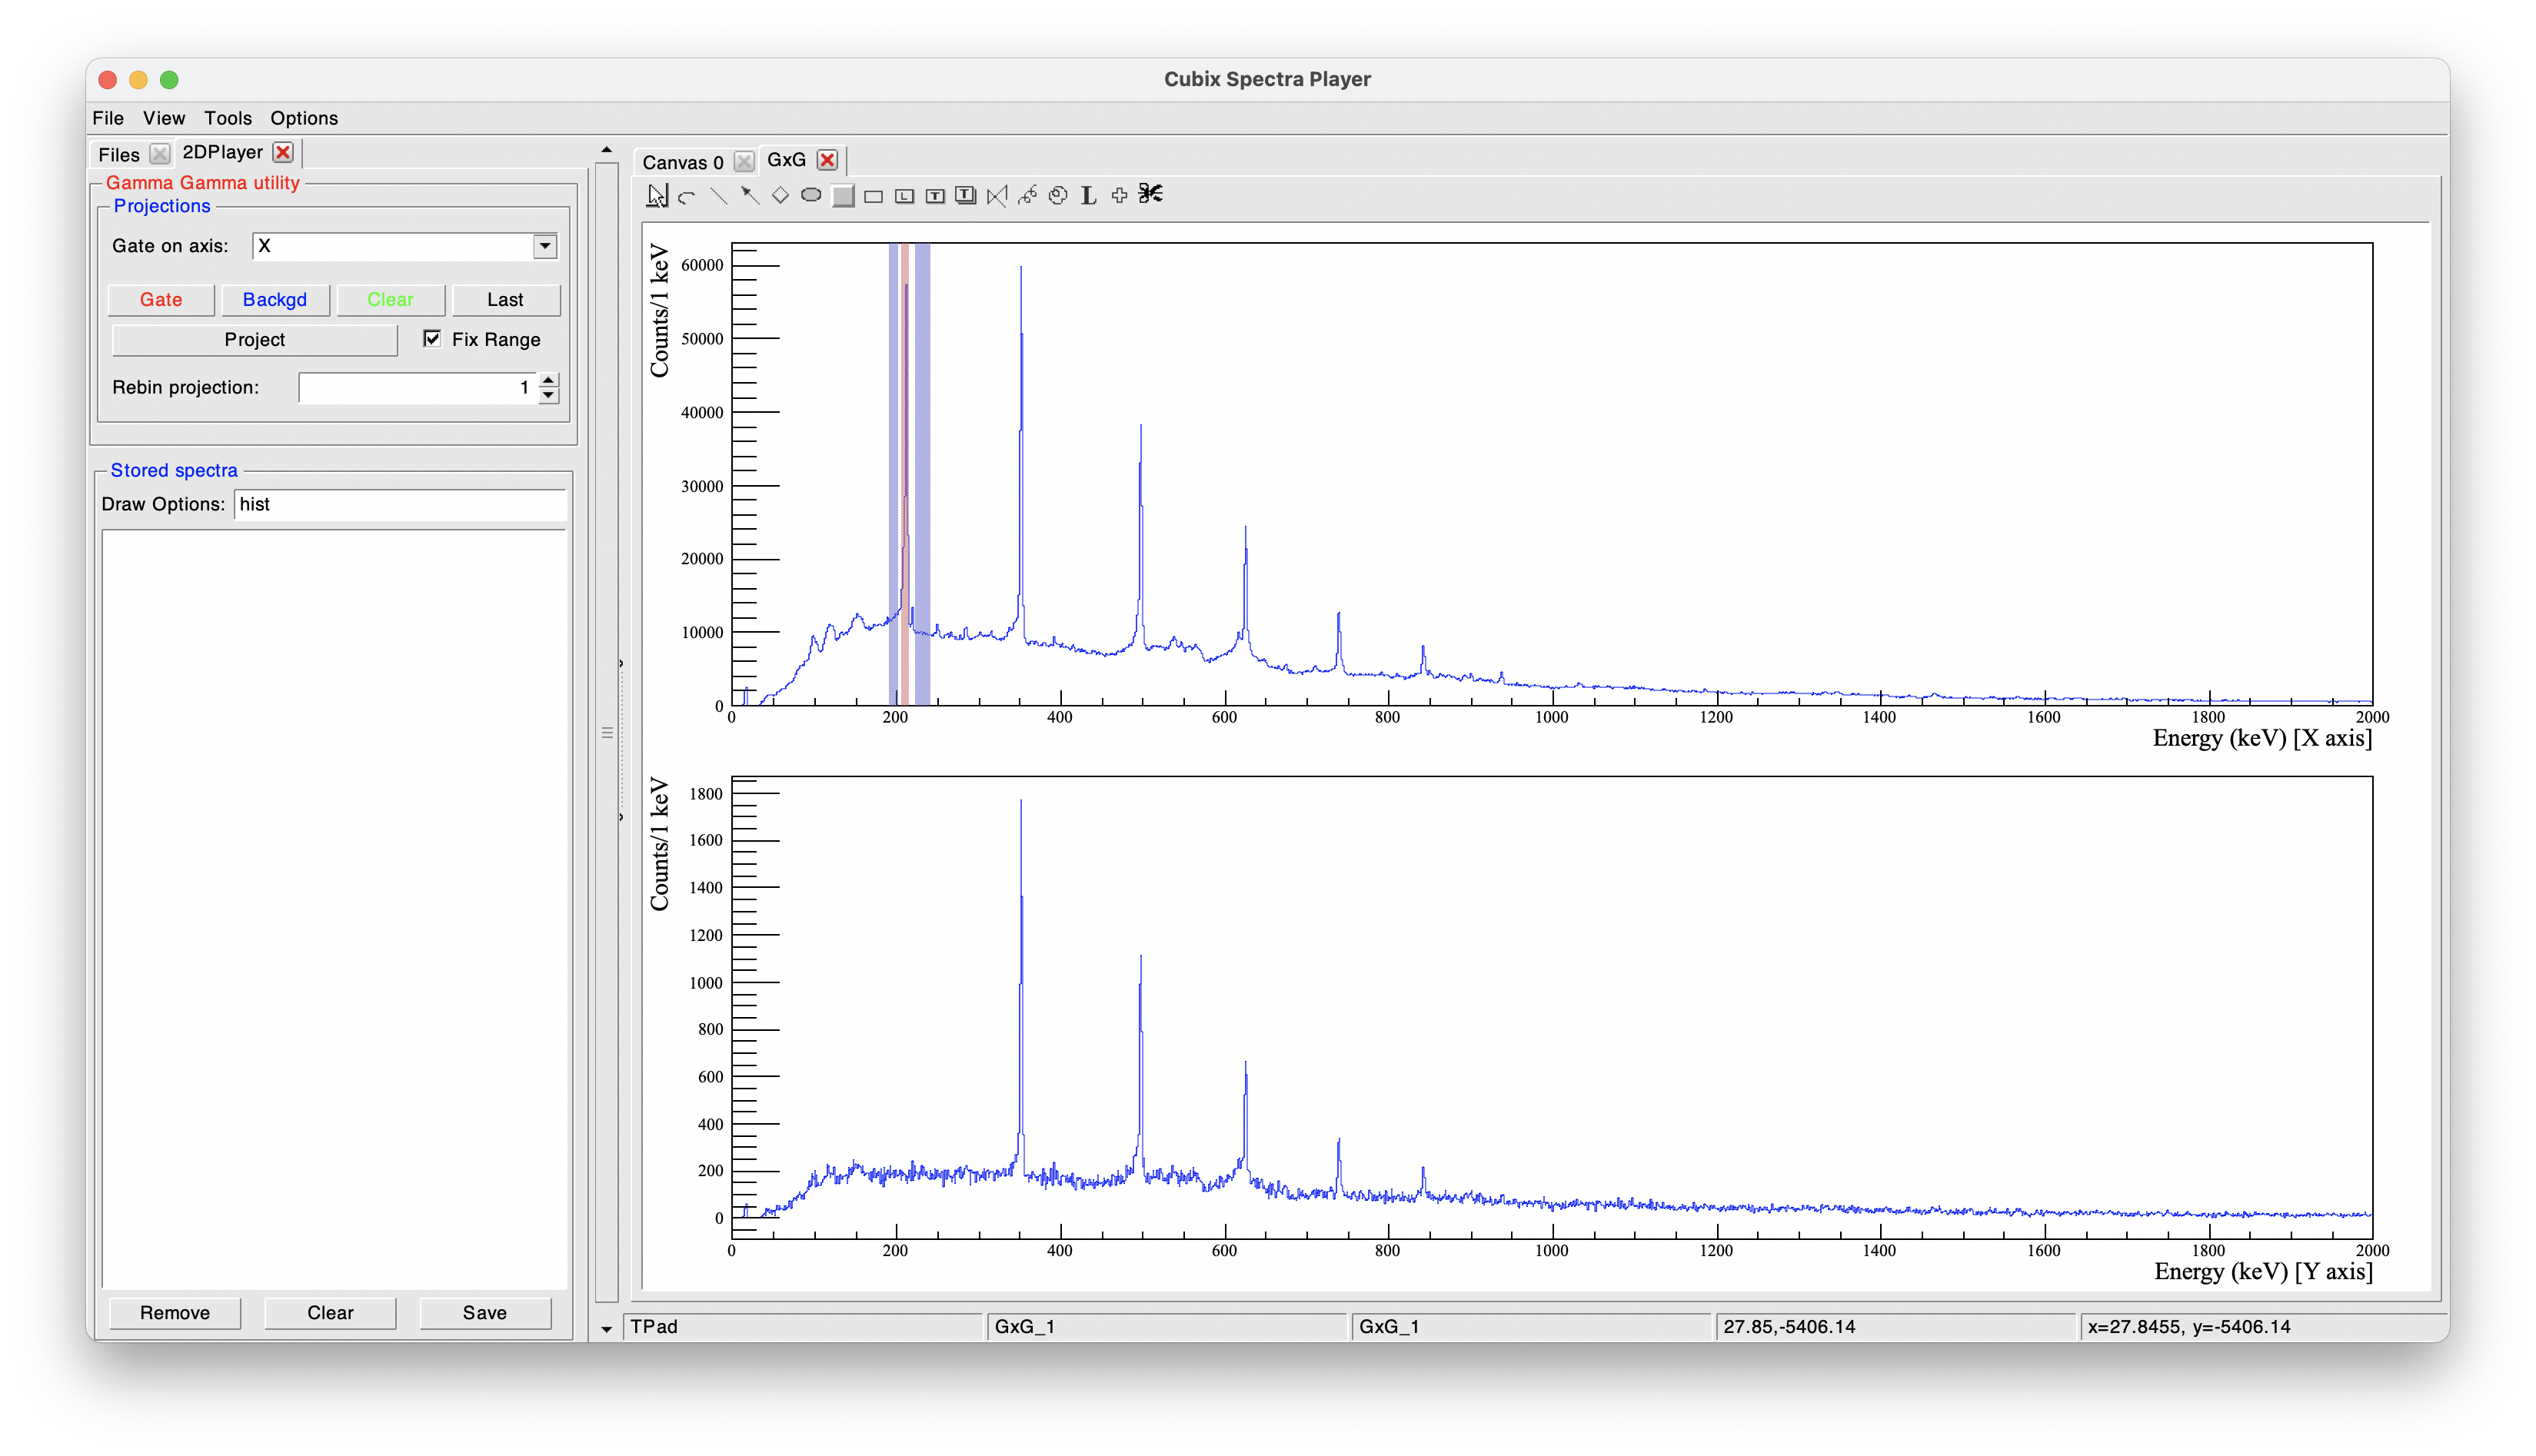
The top right part shows the total projection (see below for the projection axis).
The bottom right part displays the projection according to the selected gates and backgrounds.
The top left part contains the panel used to define the gates:
- Gate on axis: define, for asymmetric matrices, whether gates are set on the X or Y axis (default: gate on X, projection on Y)
- Gates buttons:
- Gate: Click on "Gate" to define a new gate. Once clicked, click, drag and drop on the total projection to create a red box.
- Background: Click on "Background" to define a new background. Once clicked, click, drag and drop on the total projection to create a blue box.
- Clear: Remove all the gates.
- Last: Apply the last gates configuration.
- Project: Calculate the projection according to the gates.
- Fix Range: If selected, the range of the projection will be kept as it is.
- Rebin projection: The projection will be drawn with a rebin of the histogram according to the selected value
The bottom left part shows the saved spectra utility (see Saved list utility). This is useful to store projected spectra before defining a new gate.
Because this is not a 3D input, if more than one gate is applied, the projection result is the sum of the gates (OR condition). More than one background can be defined for a single gate. It is advised to use one background before and one after the peak, as shown in the example.
 The background gates (blue) are not associated with a specific peak gate (red). The final projection is calculated as the sum of the individual gates minus the sum of the individual backgrounds, scaled so that the total width of the backgrounds corresponds to the total width of the gates.
Options to define more precisely the gates:
- Once the gate is drawn, right click on it to define manually its centroid and width.
- Rather than using the buttons, right click on the total projection and select "Add Gate" or "Add Projection" and define the centroid and width
Keyboard shortcuts:
- Zoom utilities:
- Shift and drag and drop of the mouse to define the range
- CTRL + Shift and drag and drop of the mouse to define the range for the total projection and the gated spectrum at the same time
- Gates utilities:
- g to define a new gate from the graphical interface (as clicking on the "Gate" button)
- g + g to define a new gate by defining manually the centroid and width
- b to define a new background from the graphical interface (as clicking on the "Background" button)
- b + b to define a new background by defining manually the centroid and width
- d with the mouse on a gate to remove it
- p to project
ɣ-ɣ player (radware's style)#
The \(\gamma-\gamma\) player using Radware's style provides the same main features as the standard \(\gamma-\gamma\) player, but uses the Radware method for background subtraction. When loading this utility (using "Init Radware GxG"), it will display the same kind of view as the standard \(\gamma-\gamma\) utility:
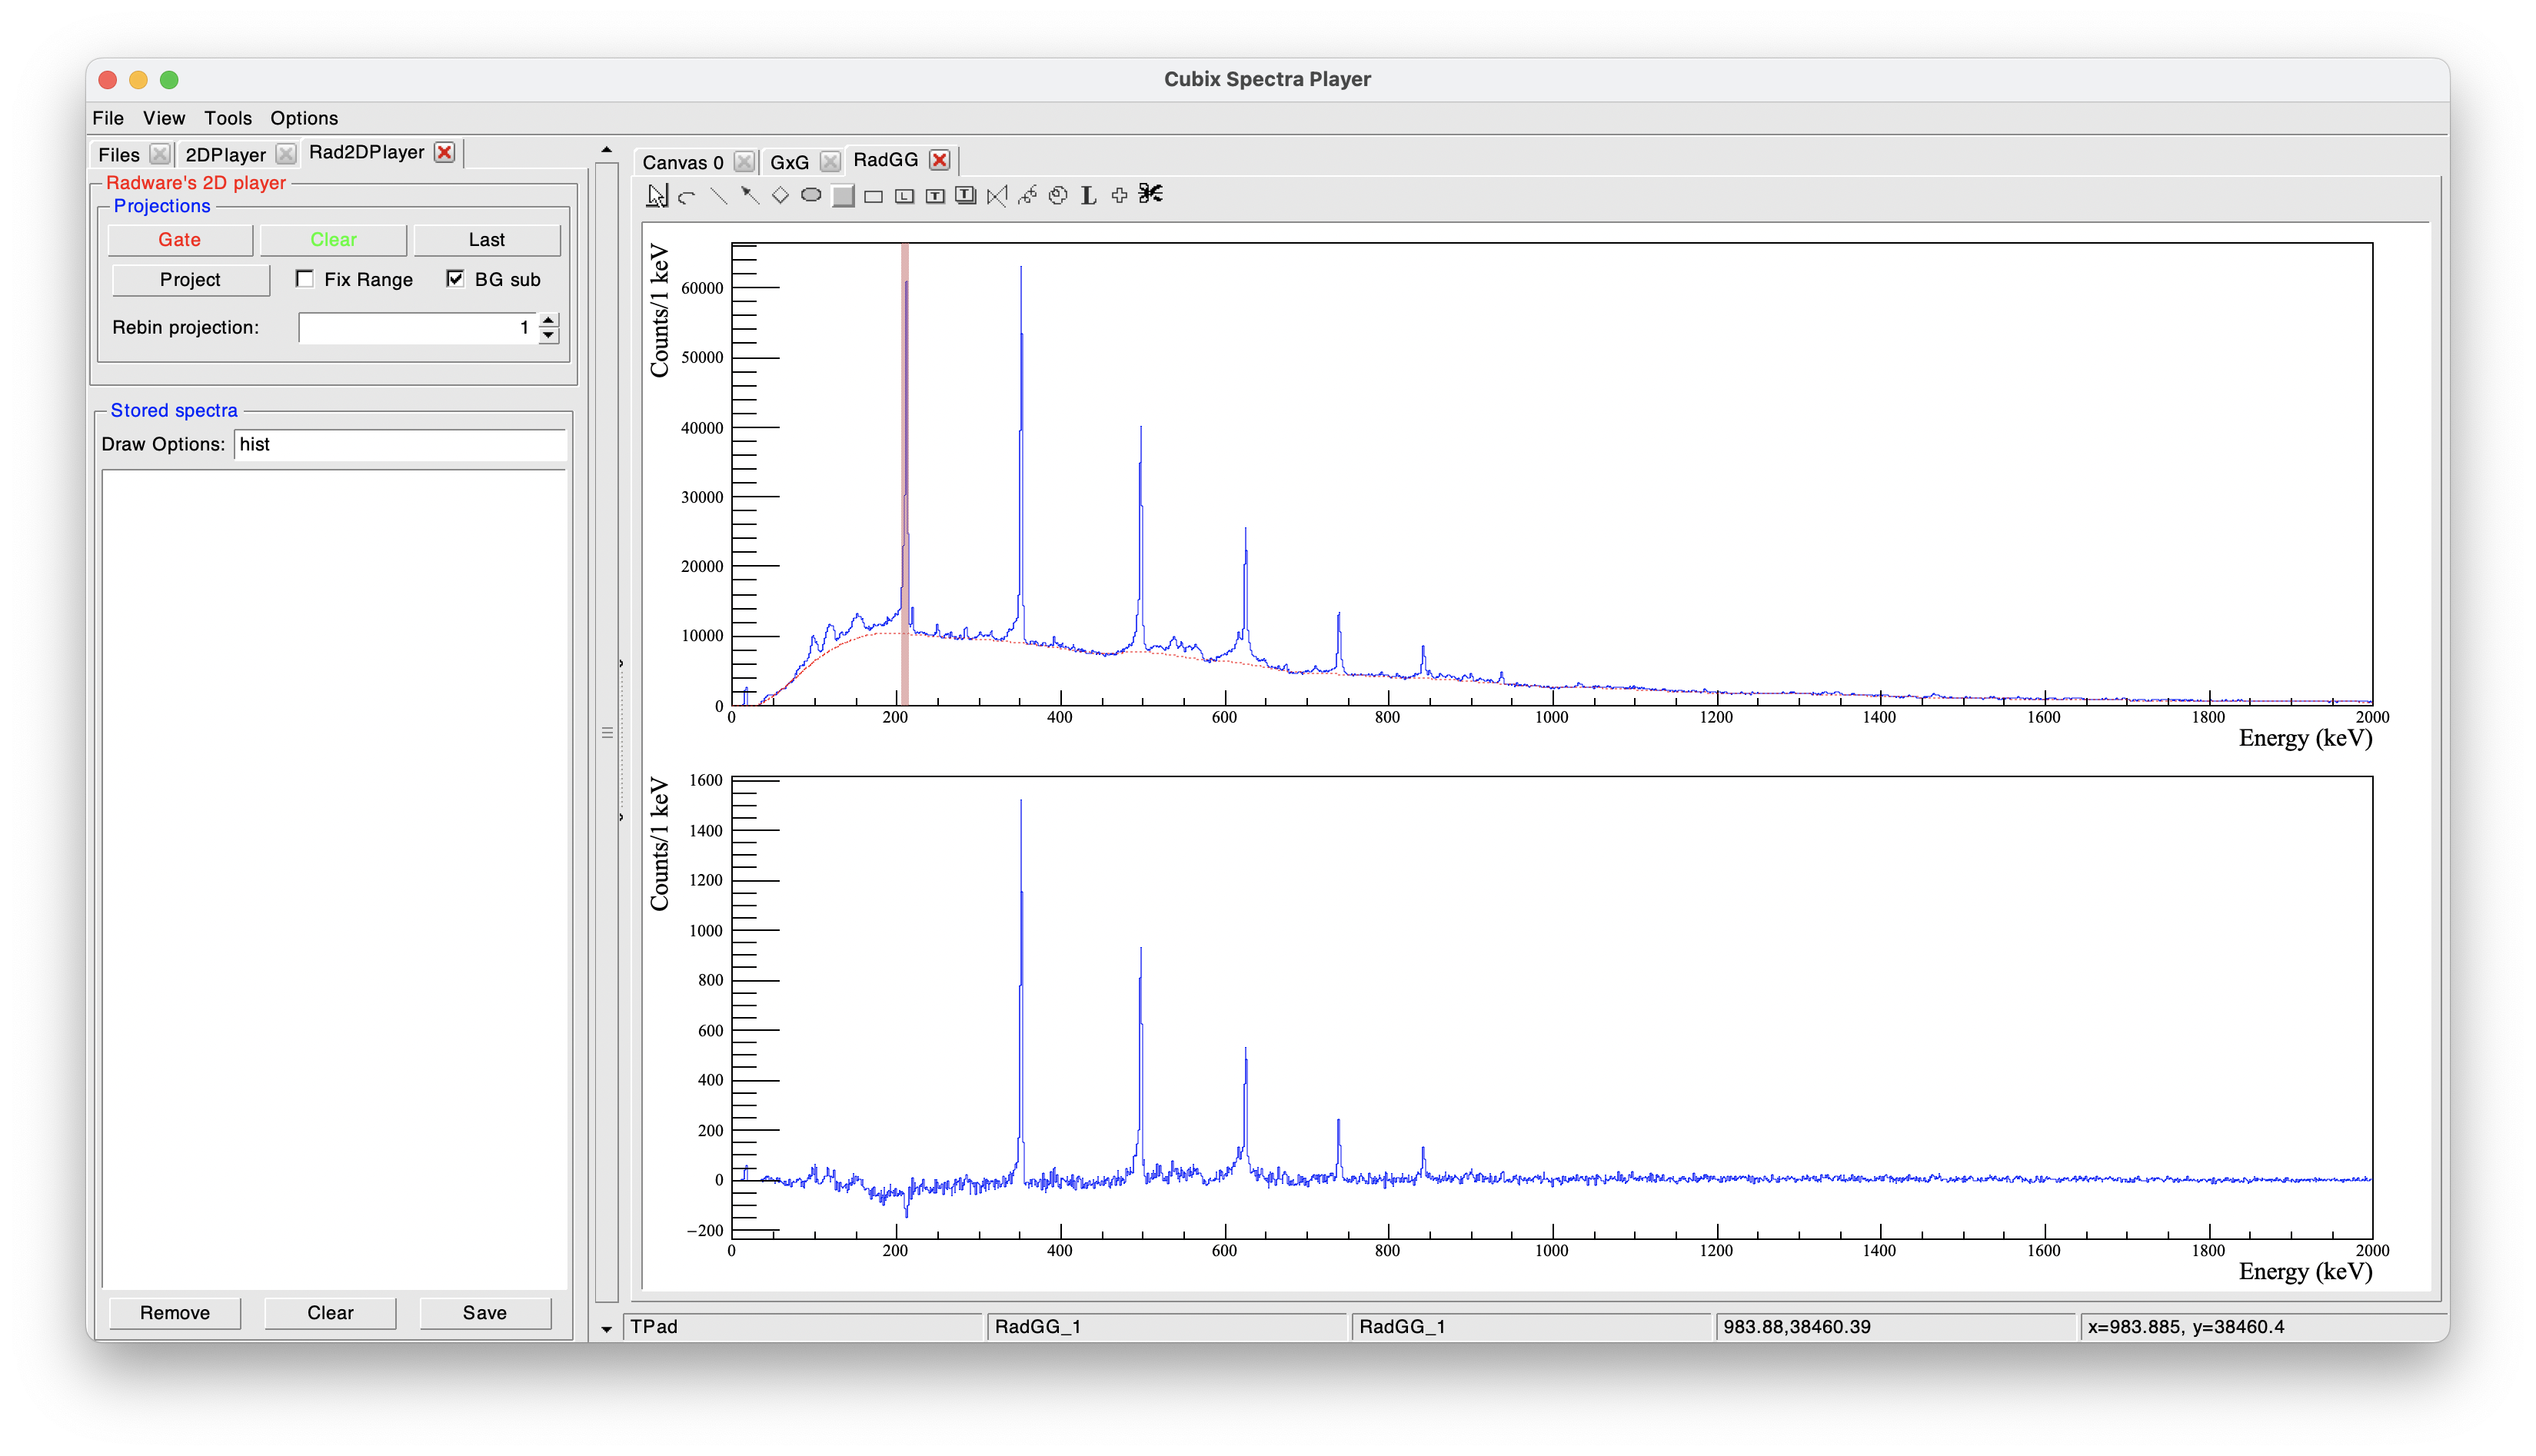
As shown in this example, background gates cannot be added because the background is calculated automatically. A background spectrum is calculated on the total projection using Radware's algorithm. It is then used to determine the background on the projected spectra. The background is first determined with Radware's default parameters, but can be adjusted by right clicking on the total projection and selecting "SetBackground".
In this mode, non-symmetrized matrices are not supported for the moment.